Imagine this: you follow someone on Twitter who has a Job Garden board. They tweet out that there are a bunch of interesting positions open. You tap through, and…
Here’s the problem. While the job titles look intriguing, you have no idea what these companies are like. They’re just names! It would be neat to have a comprehensive ka-boom I know kung-fu-style knowledge of each of those companies just by looking at each name. Even a small amount of background info could give you an hint of whether you’d like to work there.
So, to begin with, we’re working on adding just that small amount of background info. Even a company description would do.
Ideally, collecting that info would be automated. No fun typing everything in.
Fortunately, companies have homepages. Homepages are written in HTML, and HTML has hidden data intended for search engines. Search engines like Job Garden!
The question is, what data is available—we need to know this in order to design anything. And that brings me to the graphic above.
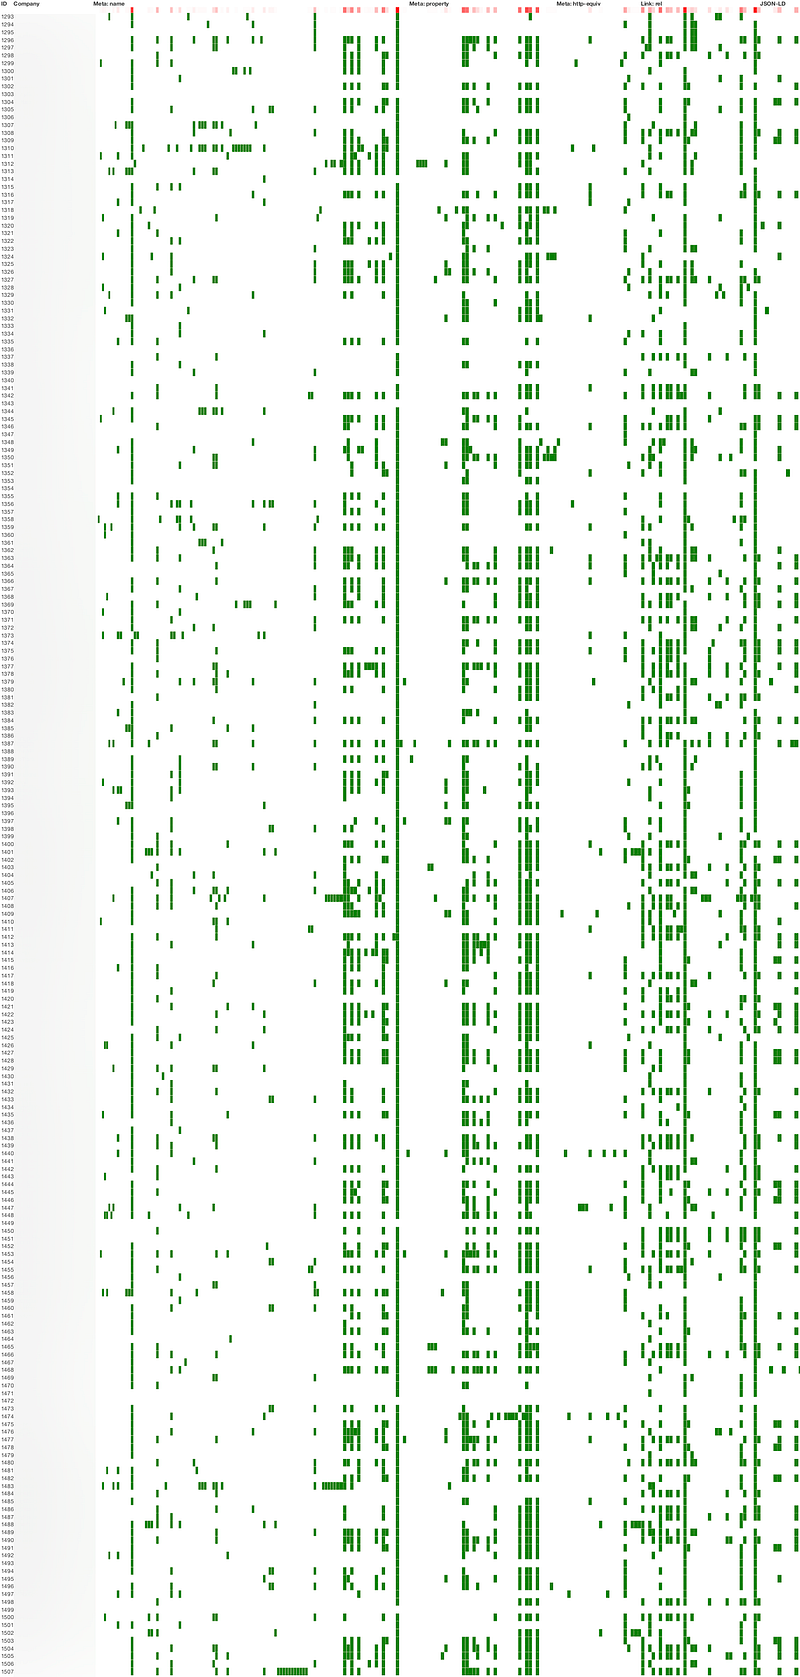
At the top of this post is a graphic that shows, down the left, all the companies that Job Garden tracks. We went and crawled all their homepages.
Across the top are all the different hidden HTML tags that are used on those homepages.
When a company provides a particular tag, there’s a green dot: ✅
By reading across, we can see that some companies use a lot of tags while others don’t use many.
The interesting bit is reading down: when you see a green vertical line, that means that many, many companies use that tag.
The header has a red mark: 🔴 The deeper the red, the more common the tag.
There are a few clusters:
- The first strong cluster just before halfway across corresponds to tags enabling Twitter cards (so that if someone tweets a link to their homepage, a corresponding image will get attached).
- The second strong cluster, about 60% of the way across, shows the popularity of the Open Graph protocol which is used to provide information to Facebook and Google.
(A few of the other strong lines unfortunately don’t correspond to data. They just indicate the page works on mobile, for example.)
Obviously we want decent coverage, so a quick data spelunking like this will guide us where to concentrate our efforts… more than likely towards Open Graph, which is something we didn’t know this time last week.
Plus the aesthetic is just _neat, _you know? It looks like genetic fingerprinting.
Here’s some genetic fingerprinting of some owls. They’ve got some clusters too.
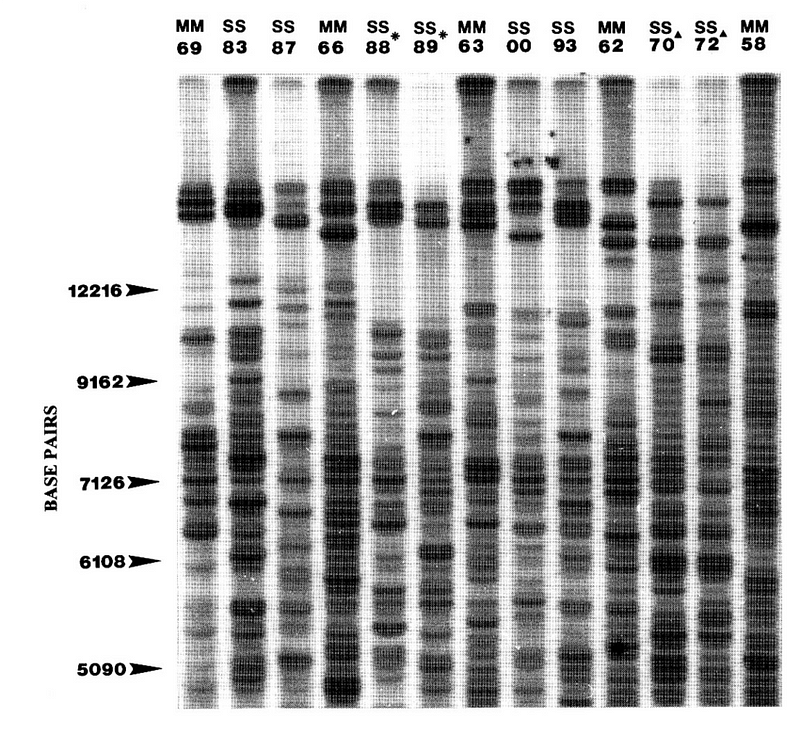
Individually Distinct Hooting in Male Pygmy Owls Glaucidium passerinum: A Multivariate Approach — Scientific Figure on ResearchGate. Available here. [Accessed 27 Mar, 2019]
Maybe they use the Open Graph protoc-owl.
See you next time.
Imagine this: you follow someone on Twitter who has a Job Garden board. They tweet out that there are a bunch of interesting positions open. You tap through, and…
Here’s the problem. While the job titles look intriguing, you have no idea what these companies are like. They’re just names! It would be neat to have a comprehensive ka-boom I know kung-fu-style knowledge of each of those companies just by looking at each name. Even a small amount of background info could give you an hint of whether you’d like to work there.
So, to begin with, we’re working on adding just that small amount of background info. Even a company description would do.
Ideally, collecting that info would be automated. No fun typing everything in.
Fortunately, companies have homepages. Homepages are written in HTML, and HTML has hidden data intended for search engines. Search engines like Job Garden!
The question is, what data is available—we need to know this in order to design anything. And that brings me to the graphic above.
At the top of this post is a graphic that shows, down the left, all the companies that Job Garden tracks. We went and crawled all their homepages.
Across the top are all the different hidden HTML tags that are used on those homepages.
When a company provides a particular tag, there’s a green dot: ✅
By reading across, we can see that some companies use a lot of tags while others don’t use many.
The interesting bit is reading down: when you see a green vertical line, that means that many, many companies use that tag.
The header has a red mark: 🔴 The deeper the red, the more common the tag.
There are a few clusters:
(A few of the other strong lines unfortunately don’t correspond to data. They just indicate the page works on mobile, for example.)
Obviously we want decent coverage, so a quick data spelunking like this will guide us where to concentrate our efforts… more than likely towards Open Graph, which is something we didn’t know this time last week.
Plus the aesthetic is just _neat, _you know? It looks like genetic fingerprinting.
Here’s some genetic fingerprinting of some owls. They’ve got some clusters too.
Individually Distinct Hooting in Male Pygmy Owls Glaucidium passerinum: A Multivariate Approach — Scientific Figure on ResearchGate. Available here. [Accessed 27 Mar, 2019]
Maybe they use the Open Graph protoc-owl.
See you next time.